Search for Indicators

LIFE at Home
A strong LIFE at Home means community leaders and residents understand and address the needs of people who are vulnerable due to their age or restricting conditions. All members of the community have the opportunity to be safe from abuse and neglect, be involved in the community through leisure activities, employment, and education, receive needed supportive care, and utilize affordable and quality childcare.
The following were identified in the 2021 Brown County LIFE Study:
-- Most consider Brown County an excellent or good place to raise a family.
-- There are concerns about safety in the life of those with disability.
-- Affordable childcare remains a deficiency.
Below are relevant data indicators to provide additional context.
Indicator Gauge Icon Legend
Legend Colors
Red is bad, green is good, blue is not statistically different/neutral.
Compared to Distribution
 the value is in the best half of communities.
 the value is in the 2nd worst quarter of communities.
 the value is in the worst quarter of communities.
Compared to Target
 meets target;
  does not meet target.
Compared to a Single Value
 lower than the comparison value;
 higher than the comparison value;
 not statistically different from comparison value.
Trend

 non-significant change over time;
 significant change over time;
  no change over time.
Compared to Prior Value
 higher than the previous measurement period;
 lower than the previous measurement period;
 no statistically different change from previous measurement period.
LIFE Study Data
LIFE Study Data
How would you rate the Brown County area in terms of affordability of adequate housing to meet our needs?
Value
Compared to:
How would you rate the Brown County area in terms of affordability of adequate housing to meet our needs? County: Brown
How would you rate the Brown County area in terms of affordability of adequate housing to meet our needs? County: Brown
7.0%
(2021)
Compared to:
Prior Value
(3.0%)
Prior Value compares a measured value with the previously measured value. Confidence intervals were not taken into account in determining the direction of the comparison.
LIFE Study Data
How would you rate the Brown County area in terms of living together as neighbors?
Value
Compared to:
How would you rate the Brown County area in terms of living together as neighbors? County: Brown
How would you rate the Brown County area in terms of living together as neighbors? County: Brown
67.0%
(2021)
Compared to:

Prior Value
(81.0%)
Prior Value compares a measured value with the previously measured value. Confidence intervals were not taken into account in determining the direction of the comparison.
LIFE Study Data
How would you rate the Brown County area in terms of a place where people with low incomes can meet their basic needs for things such as food and housing?
Value
Compared to:
How would you rate the Brown County area in terms of a place where people with low incomes can meet their basic needs for things such as food and housing? County: Brown
How would you rate the Brown County area in terms of a place where people with low incomes can meet their basic needs for things such as food and housing? County: Brown
38.0%
(2021)
Compared to:
Prior Value
(41.0%)
Prior Value compares a measured value with the previously measured value. Confidence intervals were not taken into account in determining the direction of the comparison.
National/ State/ Regional Data
National/ State/ Regional Data
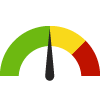
Households that are Asset Limited, Income Constrained, Employed (ALICE)
Value
Compared to:
Households that are Asset Limited, Income Constrained, Employed (ALICE) County: Brown
Households that are Asset Limited, Income Constrained, Employed (ALICE) County: Brown
24.8%
(2021)
Compared to:


WI Counties
The distribution is based on data from 72 Wisconsin counties.
WI Value
(23.0%)
The regional value is compared to the Wisconsin State value.
Prior Value
(24.3%)
Prior Value compares a measured value with the previously measured value. Confidence intervals were not taken into account in determining the direction of the comparison.
National/ State/ Regional Data
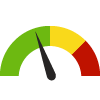
Households that are Above the Asset Limited, Income Constrained, Employed (ALICE) Threshold
Value
Compared to:
Households that are Above the Asset Limited, Income Constrained, Employed (ALICE) Threshold County: Brown
Households that are Above the Asset Limited, Income Constrained, Employed (ALICE) Threshold County: Brown
64.6%
(2021)
Compared to:

WI Counties
The distribution is based on data from 72 Wisconsin counties.
WI Value
(66.0%)
The regional value is compared to the Wisconsin State value.
Prior Value
(66.4%)
Prior Value compares a measured value with the previously measured value. Confidence intervals were not taken into account in determining the direction of the comparison.
Households Living Below Poverty Level County: Brown
Households Living Below Poverty Level County: Brown
10.6%
(2021)
Compared to:
WI Counties
The distribution is based on data from 72 Wisconsin counties.
WI Value
(11.0%)
The regional value is compared to the Wisconsin State value.
Prior Value
(9.4%)
Prior Value compares a measured value with the previously measured value. Confidence intervals were not taken into account in determining the direction of the comparison.
Households with an Internet Subscription County: Brown
Households with an Internet Subscription County: Brown
89.9%
(2018-2022)
Compared to:

WI Counties
The distribution is based on data from 72 Wisconsin counties.
U.S. Counties
The distribution is based on data from 3,133 U.S. counties and county equivalents.
WI Value
(88.1%)
The regional value is compared to the Wisconsin State value.
US Value
(88.5%)
The regional value is compared to the national value.
Trend
This comparison measures the indicator’s values over multiple time periods.<br>The Mann-Kendall Test for Statistical Significance is used to evaluate the trend<br>over 4 to 10 periods of measure, subject to data availability and comparability.
National/ State/ Regional Data
Households with One or More Types of Computing Devices
Value
Compared to:
Households with One or More Types of Computing Devices County: Brown
Households with One or More Types of Computing Devices County: Brown
93.9%
(2018-2022)
Compared to:

WI Counties
The distribution is based on data from 72 Wisconsin counties.
U.S. Counties
The distribution is based on data from 3,133 U.S. counties and county equivalents.
WI Value
(92.9%)
The regional value is compared to the Wisconsin State value.
US Value
(94.0%)
The regional value is compared to the national value.
Trend
This comparison measures the indicator’s values over multiple time periods.<br>The Mann-Kendall Test for Statistical Significance is used to evaluate the trend<br>over 4 to 10 periods of measure, subject to data availability and comparability.
Children in Single-Parent Households County: Brown
Children in Single-Parent Households County: Brown
18.8%
(2018-2022)
Compared to:
WI Counties
The distribution is based on data from 72 Wisconsin counties.
U.S. Counties
The distribution is based on data from 3,132 U.S. counties and county equivalents.
WI Value
(22.3%)
The regional value is compared to the Wisconsin State value.
US Value
(24.9%)
The regional value is compared to the national value.
Trend
This comparison measures the indicator’s values over multiple time periods.<br>The Mann-Kendall Test for Statistical Significance is used to evaluate the trend<br>over 4 to 10 periods of measure, subject to data availability and comparability.
Overcrowded Households County: Brown
Overcrowded Households County: Brown
2.1%
(2018-2022)
Compared to:
WI Counties
The distribution is based on data from 72 Wisconsin counties.
WI Value
(1.6%)
The regional value is compared to the Wisconsin State value.
US Value
(3.4%)
The regional value is compared to the national value.
Trend
This comparison measures the indicator’s values over multiple time periods.<br>The Mann-Kendall Test for Statistical Significance is used to evaluate the trend<br>over 4 to 10 periods of measure, subject to data availability and comparability.
Median Household Gross Rent County: Brown
Median Household Gross Rent County: Brown
$935
(2018-2022)
Compared to:


WI Counties
The distribution is based on data from 72 Wisconsin counties.
WI Value
($992)
The regional value is compared to the Wisconsin State value.
US Value
($1,268)
The regional value is compared to the national value.
Trend
This comparison measures the indicator’s values over multiple time periods.<br>The Mann-Kendall Test for Statistical Significance is used to evaluate the trend<br>over 4 to 10 periods of measure, subject to data availability and comparability.
Median Housing Unit Value County: Brown
Median Housing Unit Value County: Brown
$226,500
(2018-2022)
Compared to:
WI Counties
The distribution is based on data from 72 Wisconsin counties.
WI Value
($231,400)
The regional value is compared to the Wisconsin State value.
US Value
($281,900)
The regional value is compared to the national value.
Trend
This comparison measures the indicator’s values over multiple time periods.<br>The Mann-Kendall Test for Statistical Significance is used to evaluate the trend<br>over 4 to 10 periods of measure, subject to data availability and comparability.
National/ State/ Regional Data
Median Monthly Owner Costs for Households without a Mortgage
Value
Compared to:
Median Monthly Owner Costs for Households without a Mortgage County: Brown
Median Monthly Owner Costs for Households without a Mortgage County: Brown
$581
(2018-2022)
Compared to:
WI Counties
The distribution is based on data from 72 Wisconsin counties.
WI Value
($624)
The regional value is compared to the Wisconsin State value.
US Value
($584)
The regional value is compared to the national value.
Trend
This comparison measures the indicator’s values over multiple time periods.<br>The Mann-Kendall Test for Statistical Significance is used to evaluate the trend<br>over 4 to 10 periods of measure, subject to data availability and comparability.
Mortgaged Owners Median Monthly Household Costs County: Brown
Mortgaged Owners Median Monthly Household Costs County: Brown
$1,509
(2018-2022)
Compared to:

WI Counties
The distribution is based on data from 72 Wisconsin counties.
WI Value
($1,602)
The regional value is compared to the Wisconsin State value.
US Value
($1,828)
The regional value is compared to the national value.
Trend
This comparison measures the indicator’s values over multiple time periods.<br>The Mann-Kendall Test for Statistical Significance is used to evaluate the trend<br>over 4 to 10 periods of measure, subject to data availability and comparability.
Median Household Income County: Brown
Median Household Income County: Brown
$74,066
(2018-2022)
Compared to:
WI Counties
The distribution is based on data from 72 Wisconsin counties.
U.S. Counties
The distribution is based on data from 3,132 U.S. counties and county equivalents.
WI Value
($72,458)
The regional value is compared to the Wisconsin State value.
US Value
($75,149)
The regional value is compared to the national value.
Trend
This comparison measures the indicator’s values over multiple time periods.<br>The Mann-Kendall Test for Statistical Significance is used to evaluate the trend<br>over 4 to 10 periods of measure, subject to data availability and comparability.
People 65+ Living Alone County: Brown
People 65+ Living Alone County: Brown
30.9%
(2018-2022)
Compared to:

WI Counties
The distribution is based on data from 72 Wisconsin counties.
U.S. Counties
The distribution is based on data from 3,133 U.S. counties and county equivalents.
WI Value
(29.3%)
The regional value is compared to the Wisconsin State value.
US Value
(26.4%)
The regional value is compared to the national value.
Trend
This comparison measures the indicator’s values over multiple time periods.<br>The Mann-Kendall Test for Statistical Significance is used to evaluate the trend<br>over 4 to 10 periods of measure, subject to data availability and comparability.
Child Food Insecurity Rate County: Brown
Child Food Insecurity Rate County: Brown
9.9%
(2021)
Compared to:
WI Counties
The distribution is based on data from 72 Wisconsin counties.
U.S. Counties
The distribution is based on data from 3,140 U.S. counties and county equivalents.
WI Value
(11.1%)
The regional value is compared to the Wisconsin State value.
US Value
(12.8%)
The regional value is compared to the national value.
Prior Value
(13.3%)
Prior Value compares a measured value with the previously measured value. Confidence intervals were not taken into account in determining the direction of the comparison.
Trend
This comparison measures the indicator’s values over multiple time periods.<br>The Mann-Kendall Test for Statistical Significance is used to evaluate the trend<br>over 4 to 10 periods of measure, subject to data availability and comparability.
National/ State/ Regional Data
Food Insecure Children Likely Ineligible for Assistance
Value
Compared to:
Food Insecure Children Likely Ineligible for Assistance County: Brown
Food Insecure Children Likely Ineligible for Assistance County: Brown
17%
(2021)
Compared to:
WI Counties
The distribution is based on data from 72 Wisconsin counties.
U.S. Counties
The distribution is based on data from 3,134 U.S. counties and county equivalents.
WI Value
(22%)
The regional value is compared to the Wisconsin State value.
US Value
(25%)
The regional value is compared to the national value.
Prior Value
(18%)
Prior Value compares a measured value with the previously measured value. Confidence intervals were not taken into account in determining the direction of the comparison.
Trend
This comparison measures the indicator’s values over multiple time periods.<br>The Mann-Kendall Test for Statistical Significance is used to evaluate the trend<br>over 4 to 10 periods of measure, subject to data availability and comparability.
Food Insecurity Rate County: Brown
Food Insecurity Rate County: Brown
7.2%
(2021)
Compared to:
WI Counties
The distribution is based on data from 72 Wisconsin counties.
U.S. Counties
The distribution is based on data from 3,140 U.S. counties and county equivalents.
WI Value
(7.2%)
The regional value is compared to the Wisconsin State value.
US Value
(10.4%)
The regional value is compared to the national value.
Prior Value
(8.1%)
Prior Value compares a measured value with the previously measured value. Confidence intervals were not taken into account in determining the direction of the comparison.
Trend
This comparison measures the indicator’s values over multiple time periods.<br>The Mann-Kendall Test for Statistical Significance is used to evaluate the trend<br>over 4 to 10 periods of measure, subject to data availability and comparability.
Households with Cash Public Assistance Income County: Brown
Households with Cash Public Assistance Income County: Brown
2.3%
(2018-2022)
Compared to:
WI Counties
The distribution is based on data from 72 Wisconsin counties.
U.S. Counties
The distribution is based on data from 2,923 U.S. counties and county equivalents.
WI Value
(2.0%)
The regional value is compared to the Wisconsin State value.
US Value
(2.7%)
The regional value is compared to the national value.
Trend
This comparison measures the indicator’s values over multiple time periods.<br>The Mann-Kendall Test for Statistical Significance is used to evaluate the trend<br>over 4 to 10 periods of measure, subject to data availability and comparability.
Children Living Below Poverty Level County: Brown
Children Living Below Poverty Level County: Brown
12.3%
(2018-2022)
Compared to:
WI Counties
The distribution is based on data from 72 Wisconsin counties.
U.S. Counties
The distribution is based on data from 3,132 U.S. counties and county equivalents.
WI Value
(13.3%)
The regional value is compared to the Wisconsin State value.
US Value
(16.7%)
The regional value is compared to the national value.
Trend
This comparison measures the indicator’s values over multiple time periods.<br>The Mann-Kendall Test for Statistical Significance is used to evaluate the trend<br>over 4 to 10 periods of measure, subject to data availability and comparability.
People Living Below Poverty Level County: Brown
People Living Below Poverty Level County: Brown
9.7%
(2018-2022)
Compared to:
WI Counties
The distribution is based on data from 72 Wisconsin counties.
U.S. Counties
The distribution is based on data from 3,133 U.S. counties and county equivalents.
WI Value
(10.7%)
The regional value is compared to the Wisconsin State value.
US Value
(12.5%)
The regional value is compared to the national value.
Trend
This comparison measures the indicator’s values over multiple time periods.<br>The Mann-Kendall Test for Statistical Significance is used to evaluate the trend<br>over 4 to 10 periods of measure, subject to data availability and comparability.
HP 2030 Target
(8.0%)
Homeownership County: Brown
Homeownership County: Brown
62.4%
(2018-2022)
Compared to:
WI Counties
The distribution is based on data from 72 Wisconsin counties.
U.S. Counties
The distribution is based on data from 3,133 U.S. counties and county equivalents.
WI Value
(60.0%)
The regional value is compared to the Wisconsin State value.
US Value
(57.8%)
The regional value is compared to the national value.
Trend
This comparison measures the indicator’s values over multiple time periods.<br>The Mann-Kendall Test for Statistical Significance is used to evaluate the trend<br>over 4 to 10 periods of measure, subject to data availability and comparability.
