Search for Indicators

LIFE of Arts & Culture
A strong LIFE of Arts and Culture means community members experience affordable opportunities for music, visual arts, performing arts, and humanities as offered by arts organizations of all sizes and types; opportunities to develop their own creative and artistic skills; community events that bring residents together to enjoy arts that are culturally rich and diverse; a workforce rich with talented, creative, critically thinking individuals; and a community in which arts are viewed as integrated into the quality of life, not as extracurricular activities.
The following were identified in the 2021 Brown County LIFE Study:
-- There are many affordable arts and entertainment options.
-- Many see Brown County as an area in need of improved arts and culture.
-- There is room for greater support for artists and creative professionals and art performances.
-- More than any other leading indicator, there is a clear opportunity and desire to improve cultural offerings.
Below are relevant data indicators to provide additional context.
Indicator Gauge Icon Legend
Legend Colors
Red is bad, green is good, blue is not statistically different/neutral.
Compared to Distribution
 the value is in the best half of communities.
 the value is in the 2nd worst quarter of communities.
 the value is in the worst quarter of communities.
Compared to Target
 meets target;
  does not meet target.
Compared to a Single Value
 lower than the comparison value;
 higher than the comparison value;
 not statistically different from comparison value.
Trend

 non-significant change over time;
 significant change over time;
  no change over time.
Compared to Prior Value
 higher than the previous measurement period;
 lower than the previous measurement period;
 no statistically different change from previous measurement period.
LIFE Study Data
LIFE Study Data
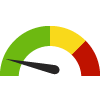
How would you rate the Brown County area in terms of the availability of arts and cultural opportunities?
Value
Compared to:
How would you rate the Brown County area in terms of the availability of arts and cultural opportunities? County: Brown
How would you rate the Brown County area in terms of the availability of arts and cultural opportunities? County: Brown
56.0%
(2021)
Compared to:

Prior Value
(67.0%)
Prior Value compares a measured value with the previously measured value. Confidence intervals were not taken into account in determining the direction of the comparison.
LIFE Study Data
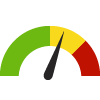
How would you rate the Brown County area in terms of providing affordable opportunities to attend dramatic and musical performances?
Value
Compared to:
How would you rate the Brown County area in terms of providing affordable opportunities to attend dramatic and musical performances? County: Brown
How would you rate the Brown County area in terms of providing affordable opportunities to attend dramatic and musical performances? County: Brown
43.0%
(2021)
Compared to:
Prior Value
(60.0%)
Prior Value compares a measured value with the previously measured value. Confidence intervals were not taken into account in determining the direction of the comparison.
LIFE Study Data
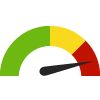
How would you rate the Brown County area in terms of providing quality festivals, parades and community events?
Value
Compared to:
How would you rate the Brown County area in terms of providing quality festivals, parades and community events? County: Brown
How would you rate the Brown County area in terms of providing quality festivals, parades and community events? County: Brown
61.0%
(2021)
Compared to:
Prior Value
(81.0%)
Prior Value compares a measured value with the previously measured value. Confidence intervals were not taken into account in determining the direction of the comparison.
National/ State/ Regional Data
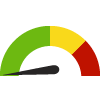
Access to Exercise Opportunities County: Brown
Access to Exercise Opportunities County: Brown
91.1%
(2024)
Compared to:
WI Counties
The distribution is based on data from 72 Wisconsin counties.
U.S. Counties
The distribution is based on data from 3,096 U.S. counties and county equivalents.
WI Value
(83.7%)
The regional value is compared to the Wisconsin State value.
US Value
(84.1%)
The regional value is compared to the national value.
Prior Value
(92.0%)
Prior Value compares a measured value with the previously measured value. Confidence intervals were not taken into account in determining the direction of the comparison.
Households with an Internet Subscription County: Brown
Households with an Internet Subscription County: Brown
89.9%
(2018-2022)
Compared to:
WI Counties
The distribution is based on data from 72 Wisconsin counties.
U.S. Counties
The distribution is based on data from 3,133 U.S. counties and county equivalents.
WI Value
(88.1%)
The regional value is compared to the Wisconsin State value.
US Value
(88.5%)
The regional value is compared to the national value.
Trend
This comparison measures the indicator’s values over multiple time periods.<br>The Mann-Kendall Test for Statistical Significance is used to evaluate the trend<br>over 4 to 10 periods of measure, subject to data availability and comparability.
Persons with an Internet Subscription County: Brown
Persons with an Internet Subscription County: Brown
92.5%
(2018-2022)
Compared to:
WI Counties
The distribution is based on data from 72 Wisconsin counties.
U.S. Counties
The distribution is based on data from 3,133 U.S. counties and county equivalents.
WI Value
(91.0%)
The regional value is compared to the Wisconsin State value.
US Value
(91.0%)
The regional value is compared to the national value.
Trend
This comparison measures the indicator’s values over multiple time periods.<br>The Mann-Kendall Test for Statistical Significance is used to evaluate the trend<br>over 4 to 10 periods of measure, subject to data availability and comparability.
