Search for Indicators

A Safe LIFE
A Safe LIFE means community members and visitors of all ages, abilities, and income levels are safe from harm or neglect in their own homes and communities, view their schools, neighborhoods, communities, and the Brown County area as safe, have confidence in law enforcement, emergency services, disaster protection response and fire, receive the support they need if they are a victim of crime, and are aware of and engage in prevention and early intervention efforts.
The following were identified in the 2021 Brown County LIFE Study:
-- Brown County is perceived as safe. There are excellent emergency services and policies that prevent crime, but some remain concerned that the county has not adequately prepared for natural disasters.
-- Local law enforcement is rated positively.
-- There are concerns with violence in the home.
Below are relevant data indicators to provide additional context.
Indicator Gauge Icon Legend
Legend Colors
Red is bad, green is good, blue is not statistically different/neutral.
Compared to Distribution
 the value is in the best half of communities.
 the value is in the 2nd worst quarter of communities.
 the value is in the worst quarter of communities.
Compared to Target
 meets target;
  does not meet target.
Compared to a Single Value
 lower than the comparison value;
 higher than the comparison value;
 not statistically different from comparison value.
Trend

 non-significant change over time;
 significant change over time;
  no change over time.
Compared to Prior Value
 higher than the previous measurement period;
 lower than the previous measurement period;
 no statistically different change from previous measurement period.
LIFE Study Data
LIFE Study Data
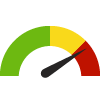
How would you rate the Brown County area in terms of providing for the safety of our residents?
Value
Compared to:
How would you rate the Brown County area in terms of providing for the safety of our residents? County: Brown
How would you rate the Brown County area in terms of providing for the safety of our residents? County: Brown
81.0%
(2021)
Compared to:

Prior Value
(86.0%)
Prior Value compares a measured value with the previously measured value. Confidence intervals were not taken into account in determining the direction of the comparison.
LIFE Study Data
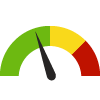
How would you rate the Brown County area in terms of the overall quality of law enforcement in your community?
Value
Compared to:
How would you rate the Brown County area in terms of the overall quality of law enforcement in your community? County: Brown
How would you rate the Brown County area in terms of the overall quality of law enforcement in your community? County: Brown
79.0%
(2021)
Compared to:
Prior Value
(89.0%)
Prior Value compares a measured value with the previously measured value. Confidence intervals were not taken into account in determining the direction of the comparison.
LIFE Study Data
How would you rate the Brown County area in terms of providing quality emergency services such as fire and ambulance services?
Value
Compared to:
How would you rate the Brown County area in terms of providing quality emergency services such as fire and ambulance services? County: Brown
How would you rate the Brown County area in terms of providing quality emergency services such as fire and ambulance services? County: Brown
87.0%
(2021)
Compared to:
Prior Value
(43.0%)
Prior Value compares a measured value with the previously measured value. Confidence intervals were not taken into account in determining the direction of the comparison.
LIFE Study Data
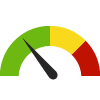
How would you rate the Brown County area in terms of caring for vulnerable persons (like children, the elderly, and persons with disabilities)?
Value
Compared to:
How would you rate the Brown County area in terms of caring for vulnerable persons (like children, the elderly, and persons with disabilities)? County: Brown
How would you rate the Brown County area in terms of caring for vulnerable persons (like children, the elderly, and persons with disabilities)? County: Brown
54.0%
(2021)
Compared to:
Prior Value
(64.0%)
Prior Value compares a measured value with the previously measured value. Confidence intervals were not taken into account in determining the direction of the comparison.
National/ State/ Regional Data
Violent Crime Rate County: Brown
Violent Crime Rate County: Brown
225.2
Crimes per 100,000 population
(2022)
Compared to:
WI Counties
The distribution is based on data from 72 Wisconsin counties.
WI Value
(298.2)
The regional value is compared to the Wisconsin State value.
Prior Value
(231.0)
Prior Value compares a measured value with the previously measured value. Confidence intervals were not taken into account in determining the direction of the comparison.
Trend
This comparison measures the indicator’s values over multiple time periods.<br>The Mann-Kendall Test for Statistical Significance is used to evaluate the trend<br>over 4 to 10 periods of measure, subject to data availability and comparability.
Alcohol-Impaired Driving Deaths County: Brown
Alcohol-Impaired Driving Deaths County: Brown
36.5%
Percent of driving deaths with alcohol involvement
(2017-2021)
Compared to:

WI Counties
The distribution is based on data from 72 Wisconsin counties.
U.S. Counties
The distribution is based on data from 3,116 U.S. counties and county equivalents.
WI Value
(35.1%)
The regional value is compared to the Wisconsin State value.
US Value
(26.3%)
The regional value is compared to the national value.
Prior Value
(37.9%)
Prior Value compares a measured value with the previously measured value. Confidence intervals were taken into account in determining the direction of the comparison.
Trend
This comparison measures the indicator’s values over multiple time periods.<br>The Mann-Kendall Test for Statistical Significance is used to evaluate the trend<br>over 4 to 10 periods of measure, subject to data availability and comparability.
Health Behaviors Ranking County: Brown
Health Behaviors Ranking County: Brown
27
(2023)
Compared to:
WI Counties
The distribution is based on data from 72 Wisconsin counties.
Adults who Binge Drink County: Brown
Adults who Binge Drink County: Brown
23.2%
(2020-2022)
Compared to:
WI Counties
The distribution is based on data from 54 Wisconsin counties.
WI Value
(23.4%)
The regional value is compared to the Wisconsin State value.
Prior Value
(25.0%)
Prior Value compares a measured value with the previously measured value. Confidence intervals were taken into account in determining the direction of the comparison.
Trend
This comparison measures the indicator’s values over multiple time periods.<br>The Mann-Kendall Test for Statistical Significance is used to evaluate the trend<br>over 4 to 10 periods of measure, subject to data availability and comparability.
HP 2020 Target
(24.2%)
<div>The Healthy People 2020 national health target is to reduce the proportion of adults aged 18 years and older engaging in binge drinking during the past 30 days to 24.2%.</div>
National/ State/ Regional Data
Households that are Above the Asset Limited, Income Constrained, Employed (ALICE) Threshold
Value
Compared to:
Households that are Above the Asset Limited, Income Constrained, Employed (ALICE) Threshold County: Brown
Households that are Above the Asset Limited, Income Constrained, Employed (ALICE) Threshold County: Brown
64.6%
(2021)
Compared to:

WI Counties
The distribution is based on data from 72 Wisconsin counties.
WI Value
(66.0%)
The regional value is compared to the Wisconsin State value.
Prior Value
(66.4%)
Prior Value compares a measured value with the previously measured value. Confidence intervals were not taken into account in determining the direction of the comparison.
Households Living Below Poverty Level County: Brown
Households Living Below Poverty Level County: Brown
10.6%
(2021)
Compared to:

WI Counties
The distribution is based on data from 72 Wisconsin counties.
WI Value
(11.0%)
The regional value is compared to the Wisconsin State value.
Prior Value
(9.4%)
Prior Value compares a measured value with the previously measured value. Confidence intervals were not taken into account in determining the direction of the comparison.
Children Living Below Poverty Level County: Brown
Children Living Below Poverty Level County: Brown
12.3%
(2018-2022)
Compared to:
WI Counties
The distribution is based on data from 72 Wisconsin counties.
U.S. Counties
The distribution is based on data from 3,132 U.S. counties and county equivalents.
WI Value
(13.3%)
The regional value is compared to the Wisconsin State value.
US Value
(16.7%)
The regional value is compared to the national value.
Trend
This comparison measures the indicator’s values over multiple time periods.<br>The Mann-Kendall Test for Statistical Significance is used to evaluate the trend<br>over 4 to 10 periods of measure, subject to data availability and comparability.
Age-Adjusted Death Rate due to All Drug Overdose County: Brown
Age-Adjusted Death Rate due to All Drug Overdose County: Brown
26.0
Deaths per 100,000 population
(2022)
Compared to:

WI Value
(32.2)
The regional value is compared to the Wisconsin State value.
Prior Value
(21.5)
Prior Value compares a measured value with the previously measured value. Confidence intervals were taken into account in determining the direction of the comparison.
Trend
This comparison measures the indicator’s values over multiple time periods.<br>The Mann-Kendall Test for Statistical Significance is used to evaluate the trend<br>over 4 to 10 periods of measure, subject to data availability and comparability.
Age-Adjusted Death Rate due to Opioid Overdose County: Brown
Age-Adjusted Death Rate due to Opioid Overdose County: Brown
22.5
Deaths per 100,000 population
(2022)
Compared to:
WI Value
(26.3)
The regional value is compared to the Wisconsin State value.
Prior Value
(22.5)
Prior Value compares a measured value with the previously measured value. Confidence intervals were taken into account in determining the direction of the comparison.
Trend
This comparison measures the indicator’s values over multiple time periods.<br>The Mann-Kendall Test for Statistical Significance is used to evaluate the trend<br>over 4 to 10 periods of measure, subject to data availability and comparability.
