Search for Indicators

Below are relevant data indicators to provide additional context.
LIFE in Our Natural Environment
A strong LIFE in Our Natural Environment means community members value and practice conservation, stewardship, and protection of the natural environment, have the opportunity to enjoy the outdoors, experience clean air and water and preserve green space and implement well-managed land development.
The following were identified in the 2021 Brown County LIFE Study:
-- We have strong support for the natural environment in Brown County, and by many measures we are doing well.
-- Most leaders perceive air quality to be high and are satisfied with progress made on the Fox River cleanup efforts.
-- Encouraging conservation is an area in need of additional support.
-- Greater implementation of green practices at the city and corporate levels is needed.
Below are relevant data indicators to provide additional context.
Indicator Gauge Icon Legend
Legend Colors
Red is bad, green is good, blue is not statistically different/neutral.
Compared to Distribution
 the value is in the best half of communities.
 the value is in the 2nd worst quarter of communities.
 the value is in the worst quarter of communities.
Compared to Target
 meets target;
  does not meet target.
Compared to a Single Value
 lower than the comparison value;
 higher than the comparison value;
 not statistically different from comparison value.
Trend

 non-significant change over time;
 significant change over time;
  no change over time.
Compared to Prior Value
 higher than the previous measurement period;
 lower than the previous measurement period;
 no statistically different change from previous measurement period.
LIFE Study Data
LIFE Study Data
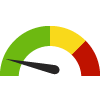
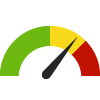
How would you rate the Brown County area in terms of quality of the air?
Value
Compared to:
How would you rate the Brown County area in terms of quality of the air? County: Brown
How would you rate the Brown County area in terms of quality of the air? County: Brown
69.0%
(2021)
Compared to:

Prior Value
(72.0%)
Prior Value compares a measured value with the previously measured value. Confidence intervals were not taken into account in determining the direction of the comparison.
LIFE Study Data
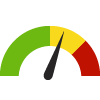
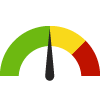
How would you rate the Brown County area in terms of the overall quality of public services (trash collection, roads, drinking water, recycling, etc.)?
Value
Compared to:
How would you rate the Brown County area in terms of the overall quality of public services (trash collection, roads, drinking water, recycling, etc.)? County: Brown
How would you rate the Brown County area in terms of the overall quality of public services (trash collection, roads, drinking water, recycling, etc.)? County: Brown
82.0%
(2021)
Compared to:
Prior Value
(86.0%)
Prior Value compares a measured value with the previously measured value. Confidence intervals were not taken into account in determining the direction of the comparison.
LIFE Study Data
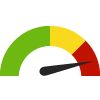
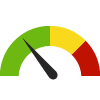
How would you rate the Brown County area in terms of the quality of the natural environment?
Value
Compared to:
How would you rate the Brown County area in terms of the quality of the natural environment? County: Brown
How would you rate the Brown County area in terms of the quality of the natural environment? County: Brown
74.0%
(2021)
Compared to:
Prior Value
(79.0%)
Prior Value compares a measured value with the previously measured value. Confidence intervals were not taken into account in determining the direction of the comparison.
LIFE Study Data
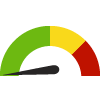
How would you rate the Brown County area in terms of the quality of the drinking water?
Value
Compared to:
How would you rate the Brown County area in terms of the quality of the drinking water? County: Brown
How would you rate the Brown County area in terms of the quality of the drinking water? County: Brown
73.0%
(2021)
Compared to:
Prior Value
(80.0%)
Prior Value compares a measured value with the previously measured value. Confidence intervals were not taken into account in determining the direction of the comparison.
National/ State/ Regional Data
Access to Exercise Opportunities County: Brown
Access to Exercise Opportunities County: Brown
91.1%
(2024)
Compared to:
WI Counties
The distribution is based on data from 72 Wisconsin counties.
U.S. Counties
The distribution is based on data from 3,096 U.S. counties and county equivalents.
WI Value
(83.7%)
The regional value is compared to the Wisconsin State value.
US Value
(84.1%)
The regional value is compared to the national value.
Prior Value
(92.0%)
Prior Value compares a measured value with the previously measured value. Confidence intervals were not taken into account in determining the direction of the comparison.
Annual Particle Pollution County: Brown
Annual Particle Pollution County: Brown
3
(2019-2021)
Compared to:

Air Quality Index
The American Lung Association (ALA) assigns grades A-F to counties (A=1; B=2; C=3; D=4; F=5), based on average annual number of days that particle pollution levels exceeded U.S. standards during the three year measurement period. The five-point grading scale was used for the distribution (Green = <2; Yellow = 2 - 3; Red = >3). The air quality data is collected by the EPA and summarized by the ALA.
Prior Value
(1)
Prior Value compares a measured value with the previously measured value. Confidence intervals were not taken into account in determining the direction of the comparison.
Trend
This comparison measures the indicator’s values over multiple time periods.<br>The Mann-Kendall Test for Statistical Significance is used to evaluate the trend<br>over 4 to 10 periods of measure, subject to data availability and comparability.
Houses Built Prior to 1950 County: Brown
Houses Built Prior to 1950 County: Brown
13.9%
(2018-2022)
Compared to:
WI Counties
The distribution is based on data from 72 Wisconsin counties.
U.S. Counties
The distribution is based on data from 3,133 U.S. counties and county equivalents.
WI Value
(23.9%)
The regional value is compared to the Wisconsin State value.
US Value
(16.7%)
The regional value is compared to the national value.
Trend
This comparison measures the indicator’s values over multiple time periods.<br>The Mann-Kendall Test for Statistical Significance is used to evaluate the trend<br>over 4 to 10 periods of measure, subject to data availability and comparability.
Lyme Disease Incidence Rate County: Brown
Lyme Disease Incidence Rate County: Brown
75.6
Cases per 100,000 population
(2022)
Compared to:


WI Counties
The distribution is based on data from 72 Wisconsin counties.
WI Value
(90.4)
The regional value is compared to the Wisconsin State value.
US Value
(18.8)
The regional value is compared to the national value. The source for the national value is Centers for Disease Control and Prevention
Prior Value
(28.9)
Prior Value compares a measured value with the previously measured value. Confidence intervals were not taken into account in determining the direction of the comparison.
Trend
This comparison measures the indicator’s values over multiple time periods.<br>The Mann-Kendall Test for Statistical Significance is used to evaluate the trend<br>over 4 to 10 periods of measure, subject to data availability and comparability.
Number of Extreme Precipitation Days County: Brown
Number of Extreme Precipitation Days County: Brown
23
Days
(2021)
Compared to:
Prior Value
(33)
Prior Value compares a measured value with the previously measured value. Confidence intervals were not taken into account in determining the direction of the comparison.
Trend
This comparison measures the indicator’s values over multiple time periods.<br>The Mann-Kendall Test for Statistical Significance is used to evaluate the trend<br>over 4 to 10 periods of measure, subject to data availability and comparability.
PBT Released County: Brown
PBT Released County: Brown
5,257
Pounds
(2022)
Compared to:
Prior Value
(4,427)
Prior Value compares a measured value with the previously measured value. Confidence intervals were not taken into account in determining the direction of the comparison.
Trend
This comparison measures the indicator’s values over multiple time periods.<br>The Mann-Kendall Test for Statistical Significance is used to evaluate the trend<br>over 4 to 10 periods of measure, subject to data availability and comparability.
Physical Environment Ranking County: Brown
Physical Environment Ranking County: Brown
23
(2023)
Compared to:
WI Counties
The distribution is based on data from 72 Wisconsin counties.
Recognized Carcinogens Released into Air County: Brown
Recognized Carcinogens Released into Air County: Brown
63,688
Pounds
(2022)
Compared to:
Prior Value
(43,444)
Prior Value compares a measured value with the previously measured value. Confidence intervals were not taken into account in determining the direction of the comparison.
Trend
This comparison measures the indicator’s values over multiple time periods.<br>The Mann-Kendall Test for Statistical Significance is used to evaluate the trend<br>over 4 to 10 periods of measure, subject to data availability and comparability.
