Search for Indicators

LIFE of Learning
A strong LIFE of Learning means community members of all ages continue to learn at all stages of life, all youth and children develop their skills and unique talents to prepare them for viable careers and a lifetime of learning, adults (young and returning) can obtain affordable higher education leading to improved career development, and learning matches area employment and opportunities.
The following were identified in the 2021 Brown County LIFE Study:
-- We have high-quality higher education but will need to continue to promote improvements across the public and private sector to keep up with changing demographics and evolving demand.
-- Ninety percent of community leaders and nearly 80 percent of community members believe Brown County is an excellent or good place to raise a family.
-- Ninety percent of community leaders and nearly 80 percent of community members believe Brown County is an excellent or good place to raise a family.
-- Quality, center-based childcare remains an area for significant improvement. Forty-six percent of leaders believe there are fair- or poor-quality affordable childcare options in Brown County.
-- There is continued concern about the costs of higher education.
-- There is continued concern about the costs of higher education.
Below are relevant data indicators to provide additional context.
Indicator Gauge Icon Legend
Legend Colors
Red is bad, green is good, blue is not statistically different/neutral.
Compared to Distribution
 the value is in the best half of communities.
 the value is in the 2nd worst quarter of communities.
 the value is in the worst quarter of communities.
Compared to Target
 meets target;
  does not meet target.
Compared to a Single Value
 lower than the comparison value;
 higher than the comparison value;
 not statistically different from comparison value.
Trend

 non-significant change over time;
 significant change over time;
  no change over time.
Compared to Prior Value
 higher than the previous measurement period;
 lower than the previous measurement period;
 no statistically different change from previous measurement period.
LIFE Study Data
LIFE Study Data
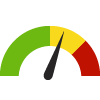
How would you rate the Brown County area in terms of investing needed resources to ensure quality education in the future?
Value
Compared to:
How would you rate the Brown County area in terms of investing needed resources to ensure quality education in the future? County: Brown
How would you rate the Brown County area in terms of investing needed resources to ensure quality education in the future? County: Brown
78.0%
(2021)
Compared to:
Prior Value
(59.0%)
Prior Value compares a measured value with the previously measured value. Confidence intervals were not taken into account in determining the direction of the comparison.
LIFE Study Data
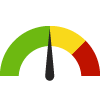
How would you rate the Brown County area in terms of overall quality of public K-12 schools?
Value
Compared to:
How would you rate the Brown County area in terms of overall quality of public K-12 schools? County: Brown
How would you rate the Brown County area in terms of overall quality of public K-12 schools? County: Brown
63.0%
(2021)
Compared to:

Prior Value
(73.0%)
Prior Value compares a measured value with the previously measured value. Confidence intervals were not taken into account in determining the direction of the comparison.
LIFE Study Data
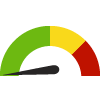
How would you rate the Brown County area in terms of providing effective education?
Value
Compared to:
How would you rate the Brown County area in terms of providing effective education? County: Brown
How would you rate the Brown County area in terms of providing effective education? County: Brown
74.0%
(2021)
Compared to:
Prior Value
(85.0%)
Prior Value compares a measured value with the previously measured value. Confidence intervals were not taken into account in determining the direction of the comparison.
LIFE Study Data
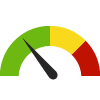
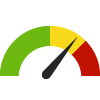
How would you rate the Brown County area in terms of providing quality affordable child care?
Value
Compared to:
How would you rate the Brown County area in terms of providing quality affordable child care? County: Brown
How would you rate the Brown County area in terms of providing quality affordable child care? County: Brown
29.0%
(2021)
Compared to:
Prior Value
(31.0%)
Prior Value compares a measured value with the previously measured value. Confidence intervals were not taken into account in determining the direction of the comparison.
National/ State/ Regional Data
Infants Born to Mothers with <12 Years Education County: Brown
Infants Born to Mothers with <12 Years Education County: Brown
8.4%
(2022)
Compared to:

WI Counties
The distribution is based on data from 67 Wisconsin counties.
WI Value
(9.5%)
The regional value is compared to the Wisconsin State value.
US Value
(11.7% in 2020)
The regional value is compared to the national value. The source for the national value is Centers for Disease Control and Prevention
Prior Value
(8.2%)
Prior Value compares a measured value with the previously measured value. Confidence intervals were not taken into account in determining the direction of the comparison.
Trend
This comparison measures the indicator’s values over multiple time periods.<br>The Mann-Kendall Test for Statistical Significance is used to evaluate the trend<br>over 4 to 10 periods of measure, subject to data availability and comparability.
People 25+ with a Bachelor's Degree or Higher County: Brown
People 25+ with a Bachelor's Degree or Higher County: Brown
31.7%
(2018-2022)
Compared to:

WI Counties
The distribution is based on data from 72 Wisconsin counties.
U.S. Counties
The distribution is based on data from 3,133 U.S. counties and county equivalents.
WI Value
(32.0%)
The regional value is compared to the Wisconsin State value.
US Value
(34.3%)
The regional value is compared to the national value.
Trend
This comparison measures the indicator’s values over multiple time periods.<br>The Mann-Kendall Test for Statistical Significance is used to evaluate the trend<br>over 4 to 10 periods of measure, subject to data availability and comparability.
People 25+ with a High School Diploma or Higher County: Brown
People 25+ with a High School Diploma or Higher County: Brown
92.9%
(2018-2022)
Compared to:
WI Counties
The distribution is based on data from 72 Wisconsin counties.
U.S. Counties
The distribution is based on data from 3,133 U.S. counties and county equivalents.
WI Value
(93.1%)
The regional value is compared to the Wisconsin State value.
US Value
(89.1%)
The regional value is compared to the national value.
Trend
This comparison measures the indicator’s values over multiple time periods.<br>The Mann-Kendall Test for Statistical Significance is used to evaluate the trend<br>over 4 to 10 periods of measure, subject to data availability and comparability.
Student-to-Teacher Ratio County: Brown
Student-to-Teacher Ratio County: Brown
13.8
Students per teacher
(2022-2023)
Compared to:


WI Counties
The distribution is based on data from 72 Wisconsin counties.
U.S. Counties
The distribution is based on data from 3,125 U.S. counties and county equivalents.
WI Value
(13.7)
The regional value is compared to the Wisconsin State value.
US Value
(15.4)
The regional value is compared to the national value.
Prior Value
(13.9)
Prior Value compares a measured value with the previously measured value. Confidence intervals were not taken into account in determining the direction of the comparison.
Trend
This comparison measures the indicator’s values over multiple time periods.<br>The Mann-Kendall Test for Statistical Significance is used to evaluate the trend<br>over 4 to 10 periods of measure, subject to data availability and comparability.
Youth not in School or Working County: Brown
Youth not in School or Working County: Brown
1.9%
(2018-2022)
Compared to:
WI Counties
The distribution is based on data from 72 Wisconsin counties.
U.S. Counties
The distribution is based on data from 3,130 U.S. counties and county equivalents.
WI Value
(1.3%)
The regional value is compared to the Wisconsin State value.
US Value
(1.8%)
The regional value is compared to the national value.
Trend
This comparison measures the indicator’s values over multiple time periods.<br>The Mann-Kendall Test for Statistical Significance is used to evaluate the trend<br>over 4 to 10 periods of measure, subject to data availability and comparability.
Households with an Internet Subscription County: Brown
Households with an Internet Subscription County: Brown
89.9%
(2018-2022)
Compared to:

WI Counties
The distribution is based on data from 72 Wisconsin counties.
U.S. Counties
The distribution is based on data from 3,133 U.S. counties and county equivalents.
WI Value
(88.1%)
The regional value is compared to the Wisconsin State value.
US Value
(88.5%)
The regional value is compared to the national value.
Trend
This comparison measures the indicator’s values over multiple time periods.<br>The Mann-Kendall Test for Statistical Significance is used to evaluate the trend<br>over 4 to 10 periods of measure, subject to data availability and comparability.
National/ State/ Regional Data
Households with One or More Types of Computing Devices
Value
Compared to:
Households with One or More Types of Computing Devices County: Brown
Households with One or More Types of Computing Devices County: Brown
93.9%
(2018-2022)
Compared to:
WI Counties
The distribution is based on data from 72 Wisconsin counties.
U.S. Counties
The distribution is based on data from 3,133 U.S. counties and county equivalents.
WI Value
(92.9%)
The regional value is compared to the Wisconsin State value.
US Value
(94.0%)
The regional value is compared to the national value.
Trend
This comparison measures the indicator’s values over multiple time periods.<br>The Mann-Kendall Test for Statistical Significance is used to evaluate the trend<br>over 4 to 10 periods of measure, subject to data availability and comparability.
