Search for Indicators

Below are relevant data indicators to provide additional context.
LIFE at Work
A strong LIFE at Work means community members of all types experience an economy that offers a lifelong continuum of job and career training opportunities, pathways from school to work, employment opportunities that enable them to support an acceptable quality of life and for their families for themselves, a growing economy that attracts and maintains an available, skilled, and motivated workforce, and a regional vision of economic growth that is explicit, widely shared, and pursued.
The following were identified in the 2021 Brown County LIFE Study:
-- Most community leaders believe the revitalization progress in downtown Green Bay is going well and encourage continued efforts.
-- There is strong support for entrepreneurship.
-- Few community leaders think Brown County does an excellent job of retaining young professionals, while 43 percent think it does a fair or poor job.
-- Flexible work continues to be an increasing need.
-- Wages are not competitive and remain below state averages.
Below are relevant data indicators to provide additional context.
Indicator Gauge Icon Legend
Legend Colors
Red is bad, green is good, blue is not statistically different/neutral.
Compared to Distribution
 the value is in the best half of communities.
 the value is in the 2nd worst quarter of communities.
 the value is in the worst quarter of communities.
Compared to Target
 meets target;
  does not meet target.
Compared to a Single Value
 lower than the comparison value;
 higher than the comparison value;
 not statistically different from comparison value.
Trend

 non-significant change over time;
 significant change over time;
  no change over time.
Compared to Prior Value
 higher than the previous measurement period;
 lower than the previous measurement period;
 no statistically different change from previous measurement period.
LIFE Study Data
LIFE Study Data
How would you rate the Brown County area in terms of a place that meets the employment needs of you and your family?
Value
Compared to:
How would you rate the Brown County area in terms of a place that meets the employment needs of you and your family? County: Brown
How would you rate the Brown County area in terms of a place that meets the employment needs of you and your family? County: Brown
68.0%
(2021)
Compared to:

Prior Value
(72.0%)
Prior Value compares a measured value with the previously measured value. Confidence intervals were not taken into account in determining the direction of the comparison.
LIFE Study Data
How would you rate the Brown County area in terms of the overall transportation system (roads, traffic, bus service, bike trails) in meeting your needs to get to work?
Value
Compared to:
How would you rate the Brown County area in terms of the overall transportation system (roads, traffic, bus service, bike trails) in meeting your needs to get to work? County: Brown
How would you rate the Brown County area in terms of the overall transportation system (roads, traffic, bus service, bike trails) in meeting your needs to get to work? County: Brown
47.0%
(2021)
Compared to:
Prior Value
(66.0%)
Prior Value compares a measured value with the previously measured value. Confidence intervals were not taken into account in determining the direction of the comparison.
LIFE Study Data
How would you rate the Brown County area in terms of providing quality affordable child care?
Value
Compared to:
How would you rate the Brown County area in terms of providing quality affordable child care? County: Brown
How would you rate the Brown County area in terms of providing quality affordable child care? County: Brown
29.0%
(2021)
Compared to:
Prior Value
(31.0%)
Prior Value compares a measured value with the previously measured value. Confidence intervals were not taken into account in determining the direction of the comparison.
LIFE Study Data
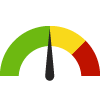
How would you rate the Brown County area in terms of building a strong economy?
Value
Compared to:
How would you rate the Brown County area in terms of building a strong economy? County: Brown
How would you rate the Brown County area in terms of building a strong economy? County: Brown
72.0%
(2021)
Compared to:
Prior Value
(76.0%)
Prior Value compares a measured value with the previously measured value. Confidence intervals were not taken into account in determining the direction of the comparison.
National/ State/ Regional Data
Size of Labor Force County: Brown
Size of Labor Force County: Brown
141,956
Persons
(January 2024)
Compared to:

Prior Value
(142,813)
Prior Value compares a measured value with the previously measured value. Confidence intervals were not taken into account in determining the direction of the comparison.
Trend
This comparison measures the indicator’s values over multiple time periods.<br>The Mann-Kendall Test for Statistical Significance is used to evaluate the trend<br>over 4 to 10 periods of measure, subject to data availability and comparability.
Per Capita Income County: Brown
Per Capita Income County: Brown
$39,091
(2018-2022)
Compared to:


WI Counties
The distribution is based on data from 72 Wisconsin counties.
U.S. Counties
The distribution is based on data from 3,133 U.S. counties and county equivalents.
WI Value
($40,130)
The regional value is compared to the Wisconsin State value.
US Value
($41,261)
The regional value is compared to the national value.
Trend
This comparison measures the indicator’s values over multiple time periods.<br>The Mann-Kendall Test for Statistical Significance is used to evaluate the trend<br>over 4 to 10 periods of measure, subject to data availability and comparability.
Total Employment County: Brown
Total Employment County: Brown
139,289
Paid Employees
(2021)
Compared to:


Prior Value
(143,640)
Prior Value compares a measured value with the previously measured value. Confidence intervals were not taken into account in determining the direction of the comparison.
Trend
This comparison measures the indicator’s values over multiple time periods.<br>The Mann-Kendall Test for Statistical Significance is used to evaluate the trend<br>over 4 to 10 periods of measure, subject to data availability and comparability.
Total Employment Change County: Brown
Total Employment Change County: Brown
-3.0%
(2020-2021)
Compared to:
WI Counties
The distribution is based on data from 72 Wisconsin counties.
U.S. Counties
The distribution is based on data from 3,140 U.S. counties and county equivalents.
WI Value
(-3.1%)
The regional value is compared to the Wisconsin State value.
US Value
(-4.3%)
The regional value is compared to the national value.
Prior Value
(-2.4%)
Prior Value compares a measured value with the previously measured value. Confidence intervals were not taken into account in determining the direction of the comparison.
Trend
This comparison measures the indicator’s values over multiple time periods.<br>The Mann-Kendall Test for Statistical Significance is used to evaluate the trend<br>over 4 to 10 periods of measure, subject to data availability and comparability.
Median Household Income County: Brown
Median Household Income County: Brown
$74,066
(2018-2022)
Compared to:

WI Counties
The distribution is based on data from 72 Wisconsin counties.
U.S. Counties
The distribution is based on data from 3,132 U.S. counties and county equivalents.
WI Value
($72,458)
The regional value is compared to the Wisconsin State value.
US Value
($75,149)
The regional value is compared to the national value.
Trend
This comparison measures the indicator’s values over multiple time periods.<br>The Mann-Kendall Test for Statistical Significance is used to evaluate the trend<br>over 4 to 10 periods of measure, subject to data availability and comparability.
Unemployed Workers in Civilian Labor Force County: Brown
Unemployed Workers in Civilian Labor Force County: Brown
2.4%
(January 2024)
Compared to:
WI Counties
The distribution is based on data from 72 Wisconsin counties.
U.S. Counties
The distribution is based on non-seasonally-adjusted data from 3,140 U.S. counties and county equivalents.
WI Value
(2.8%)
The regional value is compared to the Wisconsin State value.
US Value
(4.1%)
The regional value is compared to the national value.
Prior Value
(2.6%)
Prior Value compares a measured value with the previously measured value. Confidence intervals were not taken into account in determining the direction of the comparison.
Trend
This comparison measures the indicator’s values over multiple time periods.<br>The Mann-Kendall Test for Statistical Significance is used to evaluate the trend<br>over 4 to 10 periods of measure, subject to data availability and comparability.
Female Population 16+ in Civilian Labor Force County: Brown
Female Population 16+ in Civilian Labor Force County: Brown
64.4%
(2018-2022)
Compared to:


WI Counties
The distribution is based on data from 72 Wisconsin counties.
U.S. Counties
The distribution is based on data from 3,133 U.S. counties and county equivalents.
WI Value
(62.0%)
The regional value is compared to the Wisconsin State value.
US Value
(58.5%)
The regional value is compared to the national value.
Trend
This comparison measures the indicator’s values over multiple time periods.<br>The Mann-Kendall Test for Statistical Significance is used to evaluate the trend<br>over 4 to 10 periods of measure, subject to data availability and comparability.
Population 16+ in Civilian Labor Force County: Brown
Population 16+ in Civilian Labor Force County: Brown
66.3%
(2018-2022)
Compared to:
WI Counties
The distribution is based on data from 72 Wisconsin counties.
U.S. Counties
The distribution is based on data from 3,133 U.S. counties and county equivalents.
WI Value
(63.4%)
The regional value is compared to the Wisconsin State value.
US Value
(59.6%)
The regional value is compared to the national value.
Trend
This comparison measures the indicator’s values over multiple time periods.<br>The Mann-Kendall Test for Statistical Significance is used to evaluate the trend<br>over 4 to 10 periods of measure, subject to data availability and comparability.
